Luxury Homes in Castle Rock
Situated in Douglas County, Castle Rock is highly regarded for its quality of life, earning it a fourth place ranking in Money Magazine's Best Places to Live. This city, with its name inspired by the visible castle-like butte that can be seen for miles around, offers an array of amenities and lifestyle benefits.
Festival Park, a hub of recreation, offers a landing pavilion, a fun splash pad, cozy fire pits, expansive open space, and picnic areas among its attractions. The Phillip S. Miller Park, a 320-acre facility, boasts an array of features including batting cages, swimming pools, diverse trails, and a year-round snow sports complex.
Castle Rock is home to a variety of breweries and restaurants, contributing to its lively culinary scene. Within the community of Castle Pines North, residents enjoy a selection of homes situated in beautifully planned neighborhoods that contribute to one of the most appealing lifestyles in Colorado. The 'forever' homes here cater to virtually all needs and desires. With its picturesque tree-lined streets, 352 acres of open space, and 14 miles of trails, Castle Pines North is a community that embraces the outdoors. Elk Ridge Park and the Rueter-Hess Reservoir, located within the community, further enhance the appeal of this captivating area.
List of Zipcodes in Luxury Homes in Castle Rock
| Zip Code | Zip Code Name | Zip Code Population |
|---|---|---|
| 80104 | Castle Rock | 34,010 |
| 80105 | Deer Trail | 1,601 |
| 80109 | Castle Rock | 28,767 |
Source: Census Bureau
Demographics
State
Colorado
County
Douglas County
City
Castle Rock
Population
69,290
| Zip Code | City | County | State | National | |
|---|---|---|---|---|---|
| Population | 69,290 | 351,154 | 5,759,582 | 331,426,769 | |
| Population Density | 2,023.5 | 1,167.0 | 55.5 | 93.8 | |
| Percent Male | 50.0% | 50.0% | 49.0% | 49.0% | |
| Percent Female | 50.0% | 50.0% | 51.0% | 51.0% | |
| Median Age | 37.7 | 41.0 | 40.2 | 39.0 | |
| People per Household | 2.9 | 2.9 | 2.8 | 2.6 | |
| Median Household Income | $104,759 | $114,156 | $115,942 | $61,963 | |
| Average Income per Capital | $43,037 | $61,155 | $50,725 | $33,235 |
Source: Census Bureau
Market Data
| Zip Code | City | County | State | National | |
|---|---|---|---|---|---|
| Median Sale Price | — | $490,750 | $550,500 | $425,100 | $277,796 |
| Median Age of Home | — | 29.0 | 33.0 | 39.0 | 49.0 |
| Homes Owned | — | 75.0% | 77.0% | 67.0% | 58.0% |
| Homes Rented | — | 21.0% | 18.0% | 23.0% | 31.0% |
| Homes Vacant | — | 5.0% | 4.0% | 4.0% | 11.0% |
Sources: Census Bureau / Homendo
Source: REcolorado
This free service is provided by your local Agent
How much is your Home worth? Click here to know...
Review current market value estimates for your home, or anyone else, anywhere in the USA.
151 properties on market in Luxury Homes in Castle Rock
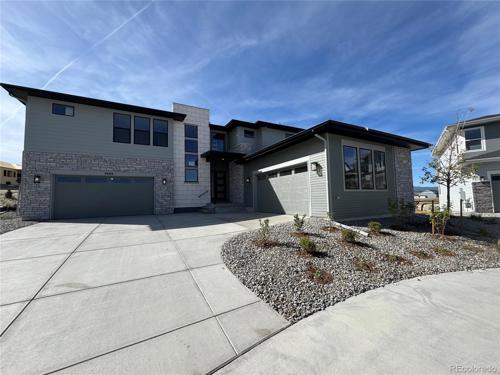 Active
Residential
MLS# 5284580 | 2024-10-21T22:53:16.506Z
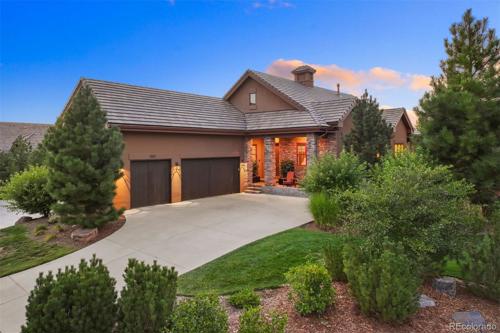 Active
Residential
MLS# 2345460 | 2024-10-21T22:10:17.107Z
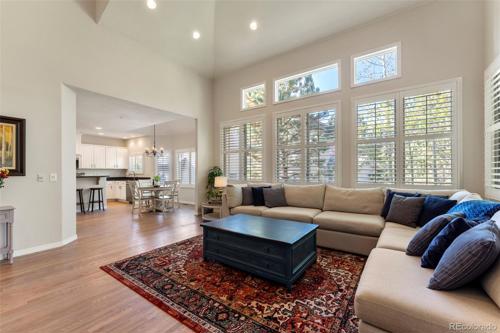 Active
Residential
MLS# 6044137 | 2024-10-21T20:02:17.071Z
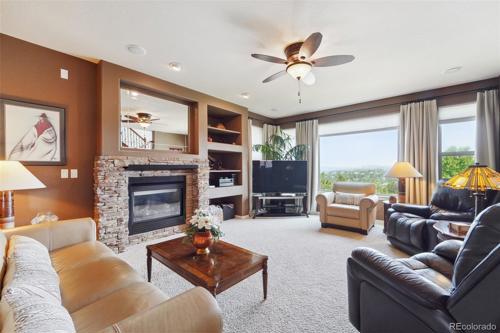 Active
Residential
MLS# 9368619 | 2024-10-21T19:56:16.421Z
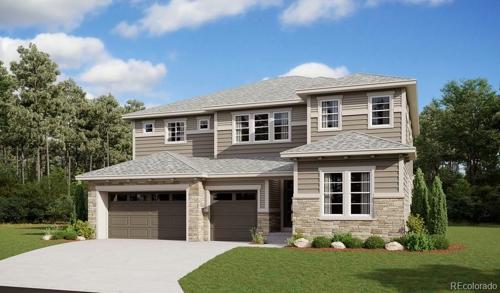 Active
Residential
MLS# 9335065 | 2024-10-21T19:50:18.147Z
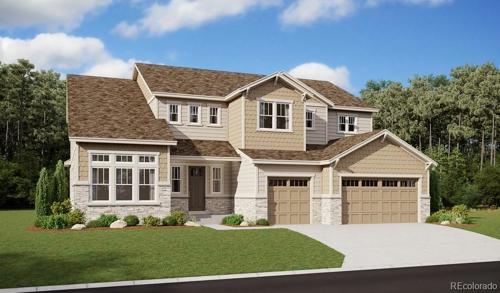 Active
Residential
MLS# 9230712 | 2024-10-21T19:50:18.073Z
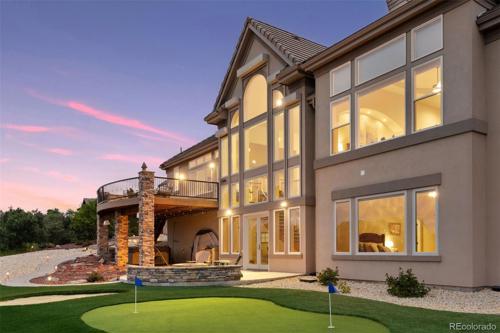 Active
Residential
MLS# 2389294 | 2024-10-21T16:50:17.144Z
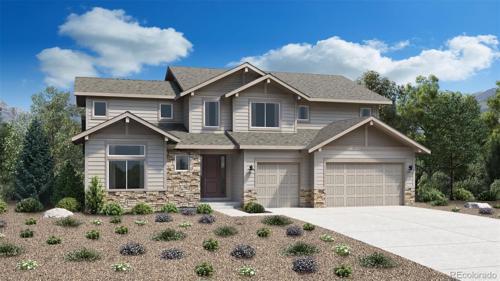 Active
Residential
MLS# 1618984 | 2024-10-21T16:24:16.720Z
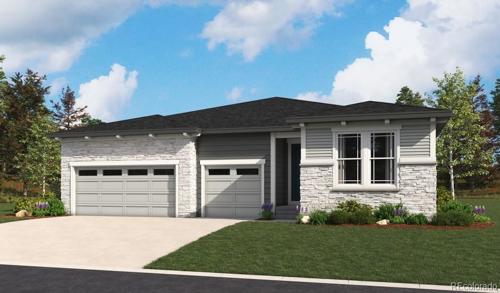 Active
Residential
MLS# 7714649 | 2024-10-21T16:09:16.426Z
This free service is provided by your local Agent
Need more listings? Click here to search now...
15 minutes updated and accurate properties direct from your local agent. Home Evaluation. Get Loan Pre-Qualified.
Doug James
RE/MAX Professionals
6020 Greenwood Plaza Boulevard
Greenwood Village, CO 80111, USA
6020 Greenwood Plaza Boulevard
Greenwood Village, CO 80111, USA
- (303) 814-3684 (Showing)
- Invitation Code: homes4u
- doug@dougjamesteam.com
- https://DougJamesRealtor.com
Contact Me
Valuation Index
- Quality of Life
- Climate & Environment
- Schools & Education
- Safety & Crime
- 90%
- 81%
- 81%
- 13%
Source: Homendo
Quality of Life
Cost of Living
116.0
Health Cost Index
125.0
Commute Time
28.0
Working from Home
7.0%
| Zip Code | City | County | State | National | |
|---|---|---|---|---|---|
| Cost of Living Index | 116.0 | 116.0 | 110.0 | 100.0 | |
| Health Cost Index | 125.0 | 124.0 | 119.0 | 100.0 | |
| Commute Time | 28.0 | 27.0 | 25.0 | 24.8 | |
| Commuting by Bus | 1.0% | 2.0% | 1.2% | 2.1% | |
| Commuting by Carpool | 10.0% | 8.0% | 11.0% | 13.5% | |
| Commuting by Auto | 83.0% | 83.0% | 80.0% | 79.1% | |
| Working at Home | 7.0% | 7.0% | 5.2% | 4.7% |
Source: Census Bureau
Walk Score®
Source: Walk Score®
Climate & Environment
January Average Low Temperature
13.6 °F
July Average High Temperature
84.0 °F
Annual Precipitation (inch)
17 inches
| Zip Code | City | County | State | National | |
|---|---|---|---|---|---|
| January Average Low Temperature | °F | 13.6 °F | 15.9 °F | 13.7 °F | 22.6 °F |
| July Average High Temperature | °F | 84.0 °F | 89.5 °F | 77.5 °F | 86.1 °F |
| Annual Precipitation (inch) | in. | 17 in. | 18 in. | 19 in. | 38 in. |
Source: NOAA Climate
Safety & Crime
Violent Crimes
273.7
Property Crimes
1,569.4
| Zip Code | City | County | State | National | |
|---|---|---|---|---|---|
Violent CrimesCalculated annually per 100,000 residents |
|||||
| Assault | — | 146.3 | 69.5 | 246.3 | 250.2 |
| Murder | — | 2.2 | 2.2 | 3.8 | 5.0 |
| Rape | — | 67.9 | 33.6 | 67.2 | 42.6 |
| Robbery | — | 57.3 | 19.2 | 63.6 | 81.6 |
Property CrimesCalculated annually per 100,000 residents |
|||||
| Burglary | — | 204.5 | 230.1 | 348.4 | 340.5 |
| Theft | — | 763.7 | 1,794.6 | 1,858.3 | 1,549.5 |
| Motor Vehicle Theft | — | 601.2 | 88.7 | 384.0 | 219.9 |
Source: FBI - Crime Data Explorer


 Menu
Menu


